ShopifyMarketing
Dashboard creation
Shopify orders alone do not show the full status of subscription contracts or how many payments customers have completed. Huckleberry contracts alone do not include one-time items bought alongside a subscription, settled sales, or a complete purchase history.
I joined Shopify order and customer CSVs, a product master, and Huckleberry CSVs at both order and contract level to build a local dashboard for checking sales, gross profit, F2, subscription LTV, retention, churn, and data quality under consistent definitions.
Define Each Data Source’s Role Before Adding More Data
Orders, customers, products, and subscription contracts record the same commercial activity from different angles. Forcing one source to serve as the full record can make a one-time item look like a subscription product or count future sales from a canceled contract in LTV.
I fixed import rules against CSVs officially exported from Shopify and Huckleberry and each service’s published field definitions. The company maintains the product master for SKUs, product categories, and costs.
Each source has a defined role: the order CSV provides settled sales and line items; the customer CSV identifies customers; the product master provides SKUs and costs; Huckleberry’s order CSV tracks subscription events; and its contract CSV defines contract status and the retention population.
| Shopify Orders CSV | Provides order IDs, payment status, refunds, line items, discounts, and order totals. |
|---|---|
| Shopify Customers CSV | Uses the Shopify customer ID as the primary key. A normalized email is a secondary key only when the ID is missing. |
| Product Master | Maps sales SKUs to products and categories, then adds unit cost and quantity multipliers. |
| Huckleberry Subscription Orders CSV | Tracks subscription order events and successful payment counts. |
| Huckleberry Subscription Contracts CSV | Provides each contract’s products, start date, status, next billing date, and cancellation reason. |
Define Sales and Retention Before Building Charts
Settled sales include only paid orders that have not been refunded. Pending and authorized payments are kept separate as provisional and excluded from settled sales, orders, customers, item counts, costs, gross profit, and LTV. Fully and partially refunded orders are excluded at order level.
Subscription LTV uses only successful payments for products in a contract. One-time items bought with the first order count toward Shopify sales but not subscription LTV. Retention cohorts show the share reaching each payment number; churn cohorts show confirmed cumulative cancellations, reporting different outcomes for the same contract population.
Do not guess customer IDs, costs, subscription statuses, or cancellation reasons that are absent from the source data. Show missing values on the data-quality screen; avoid inventing numbers.
The Dashboard Covers More Than Sales
Sales and Products
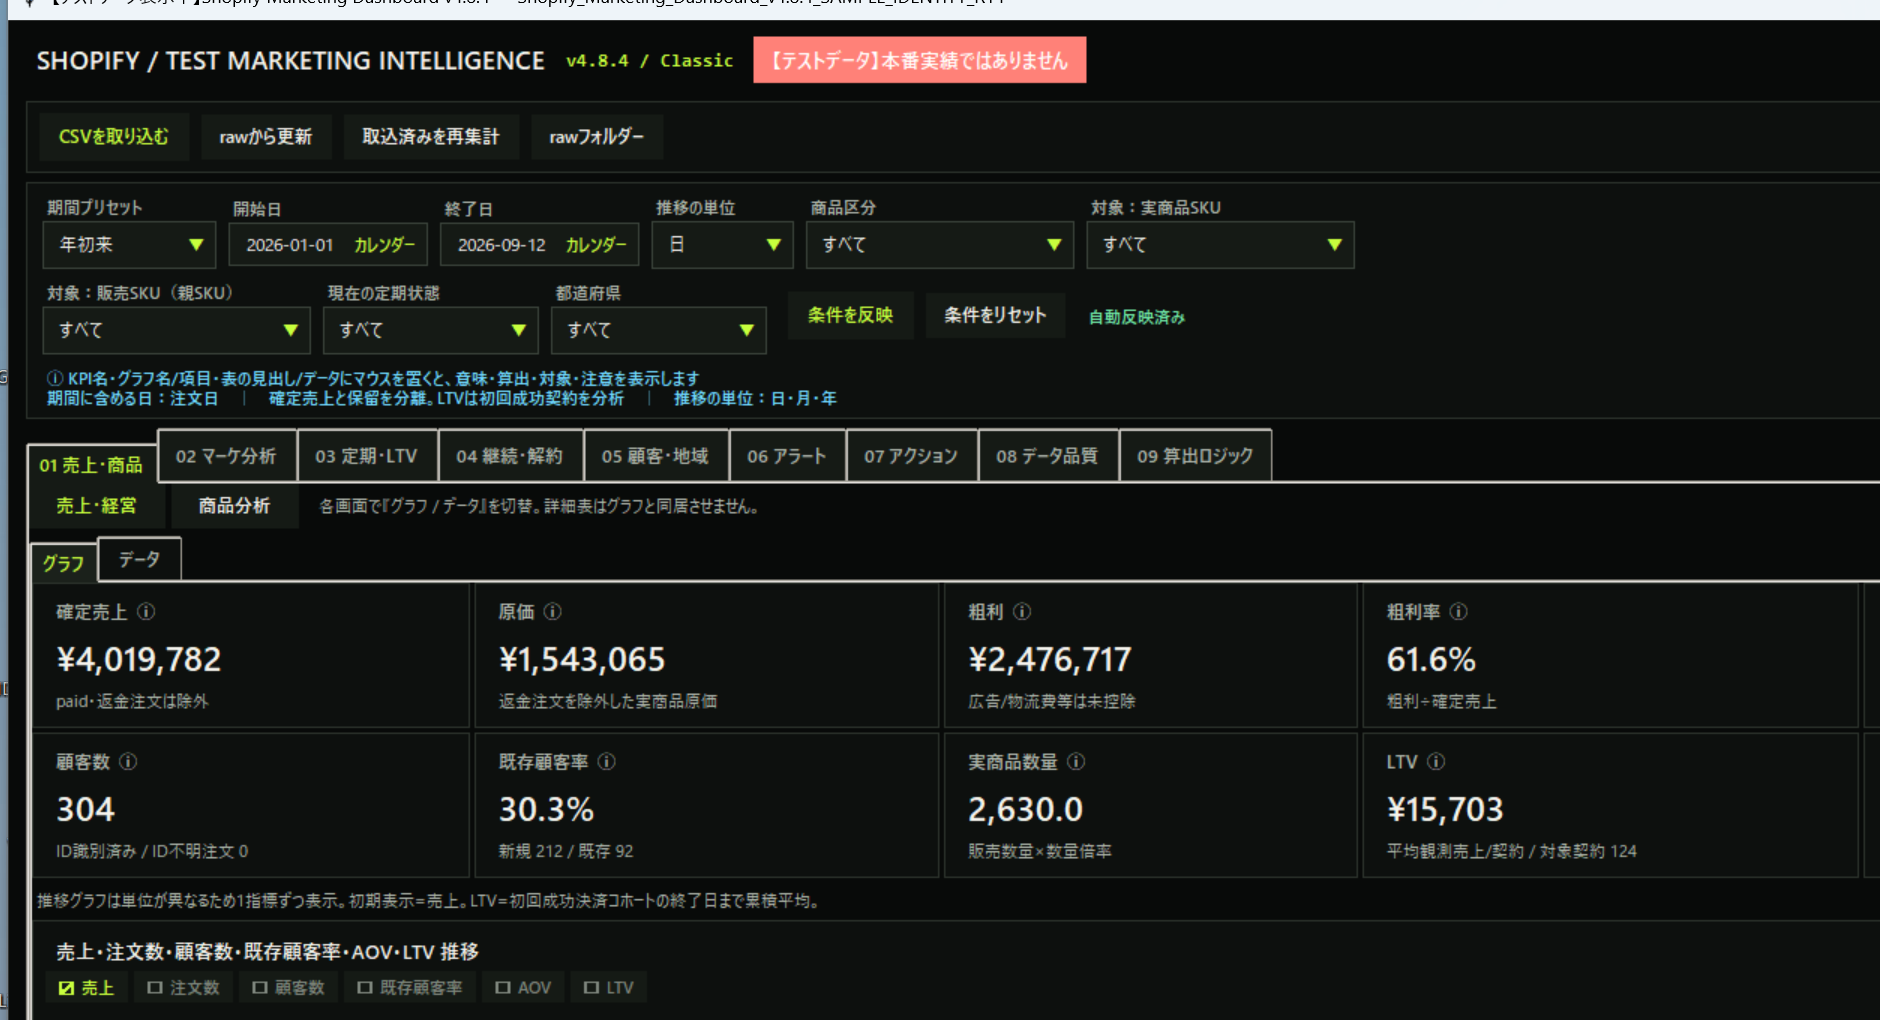
Review settled sales, orders, customers, units sold, costs, gross profit and margin, and product trends.
Marketing
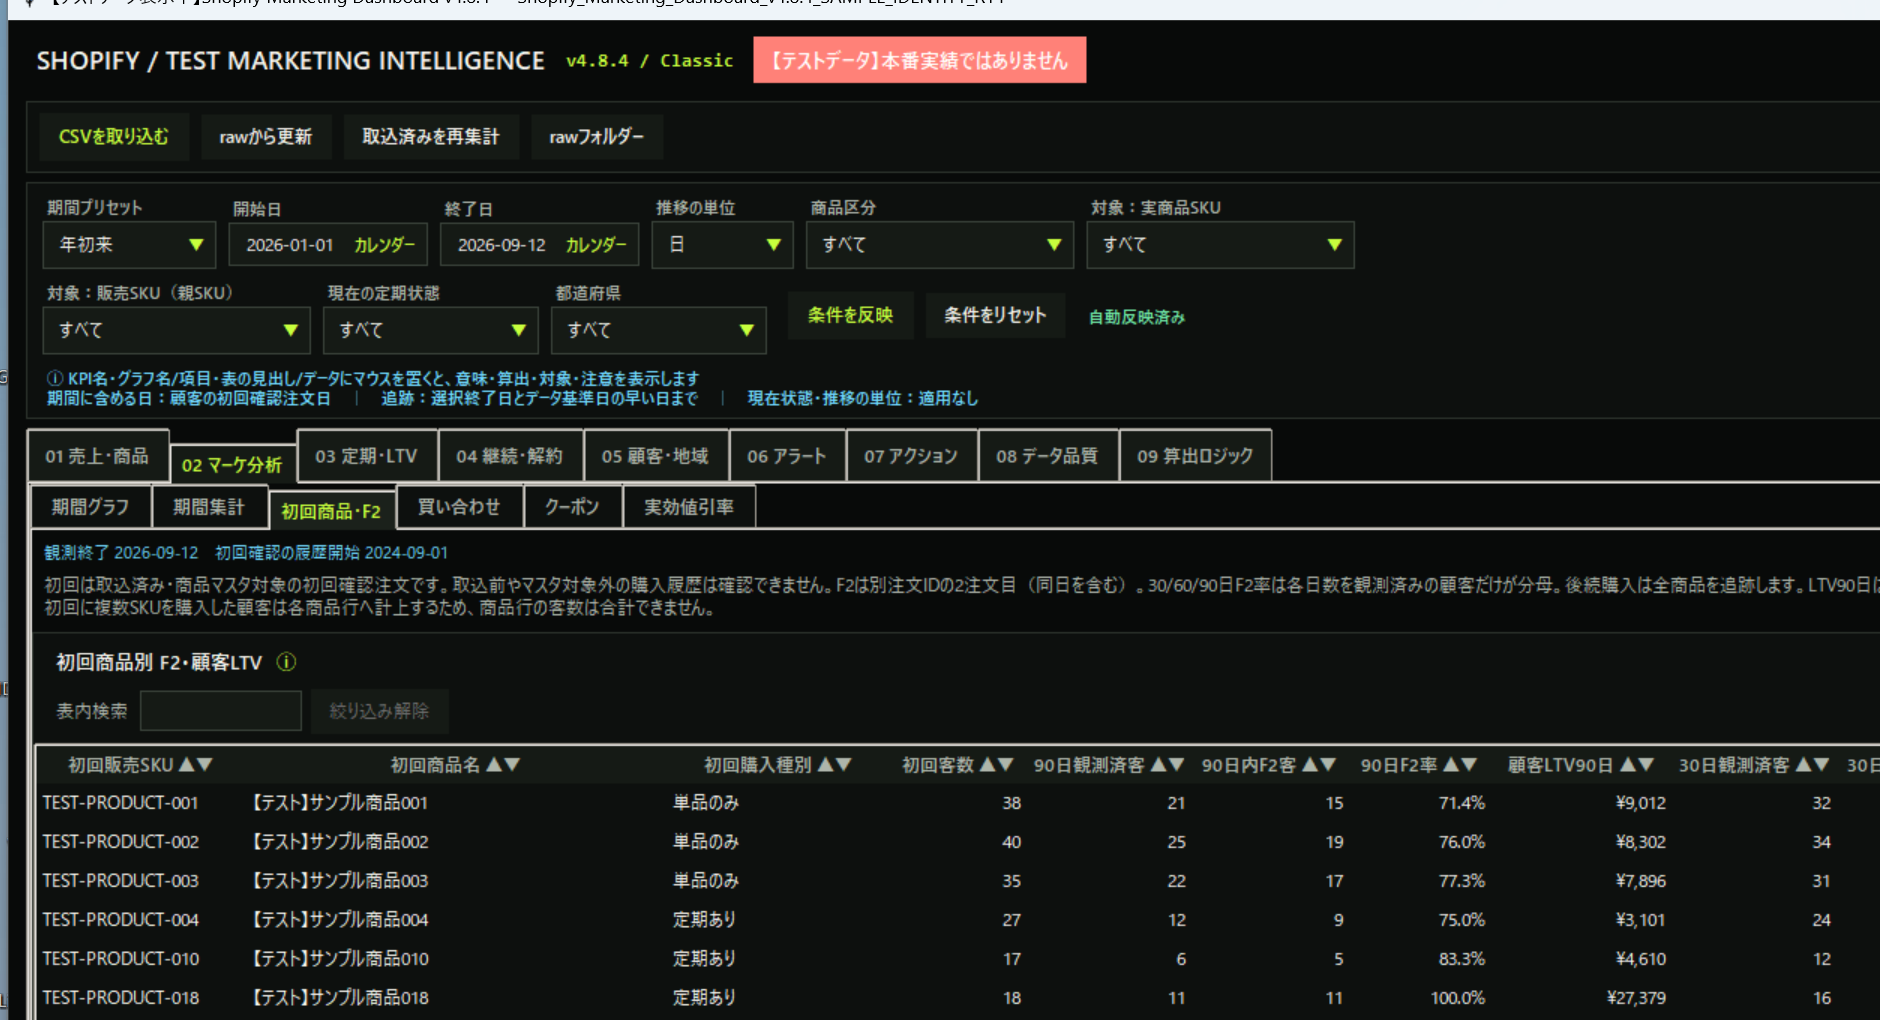
Review F2 rates by first-purchase product, cross-sells, coupons, effective discounts, and 90-day LTV.
Subscriptions and LTV
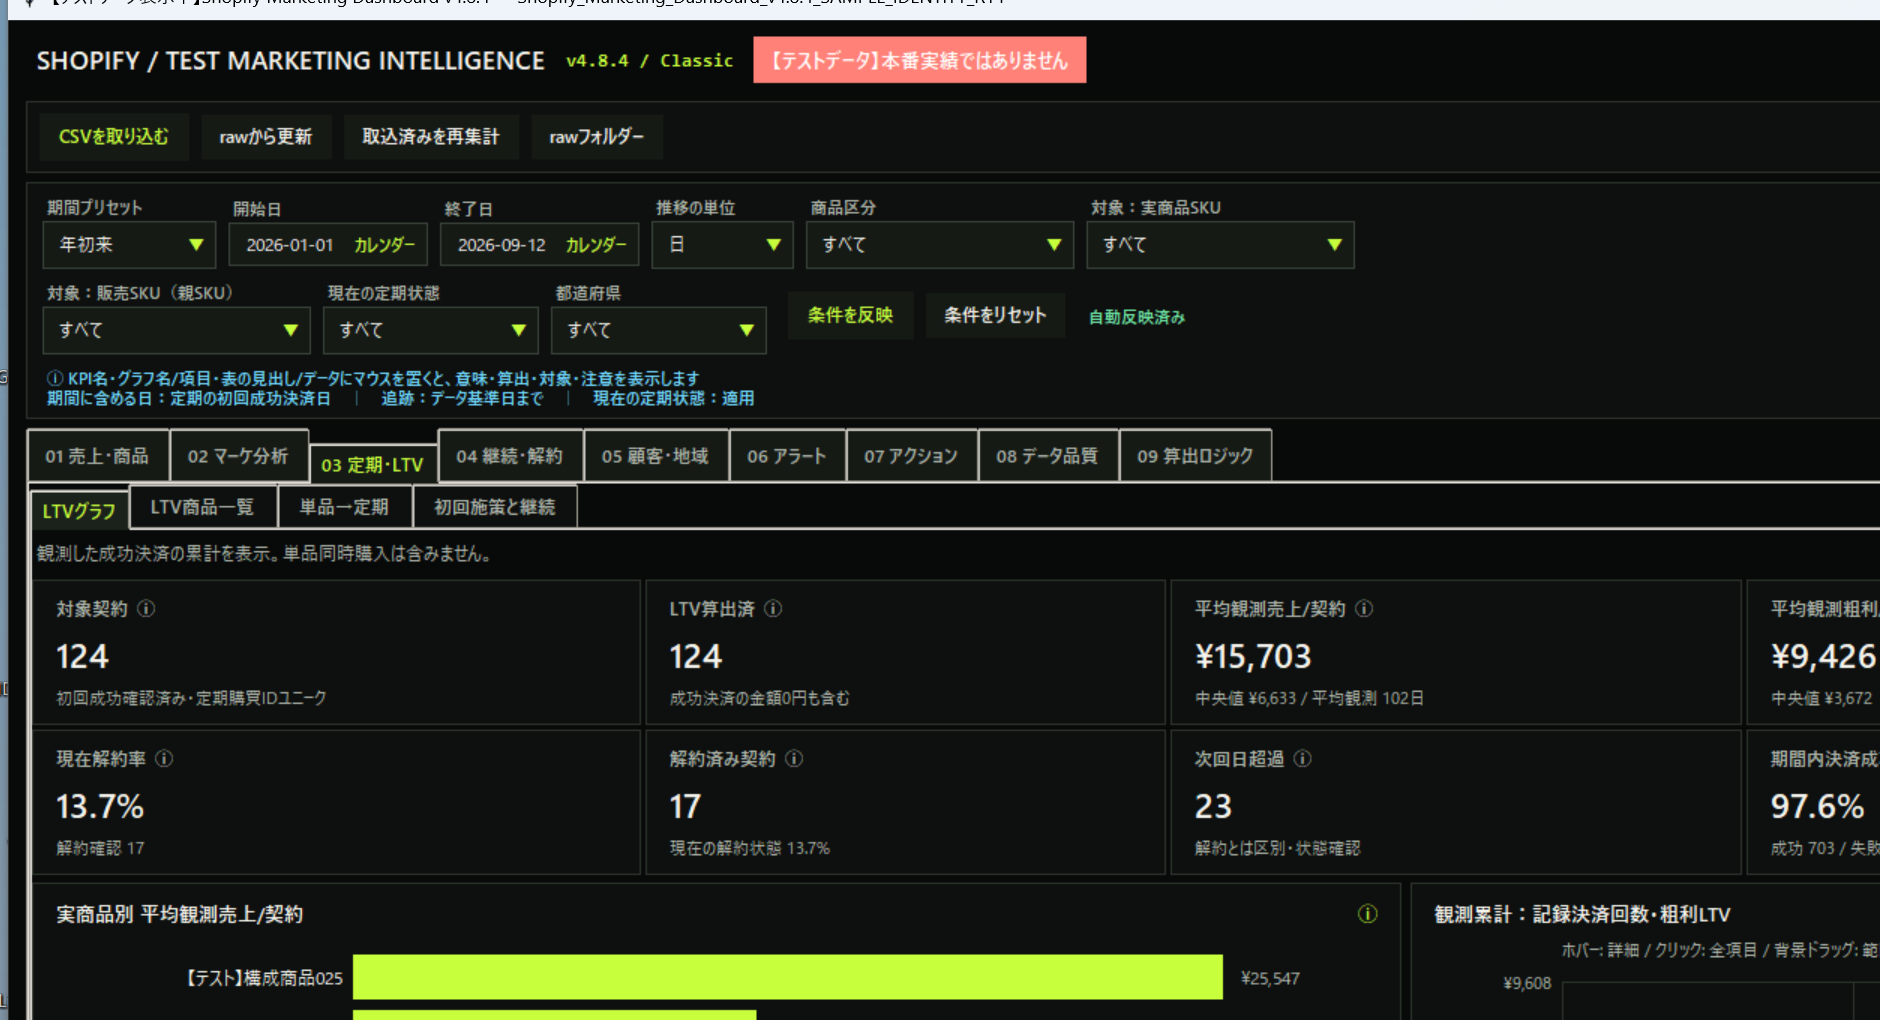
Review one-time-to-subscription conversion, LTV per contract and product, and payment milestones.
Retention and Churn
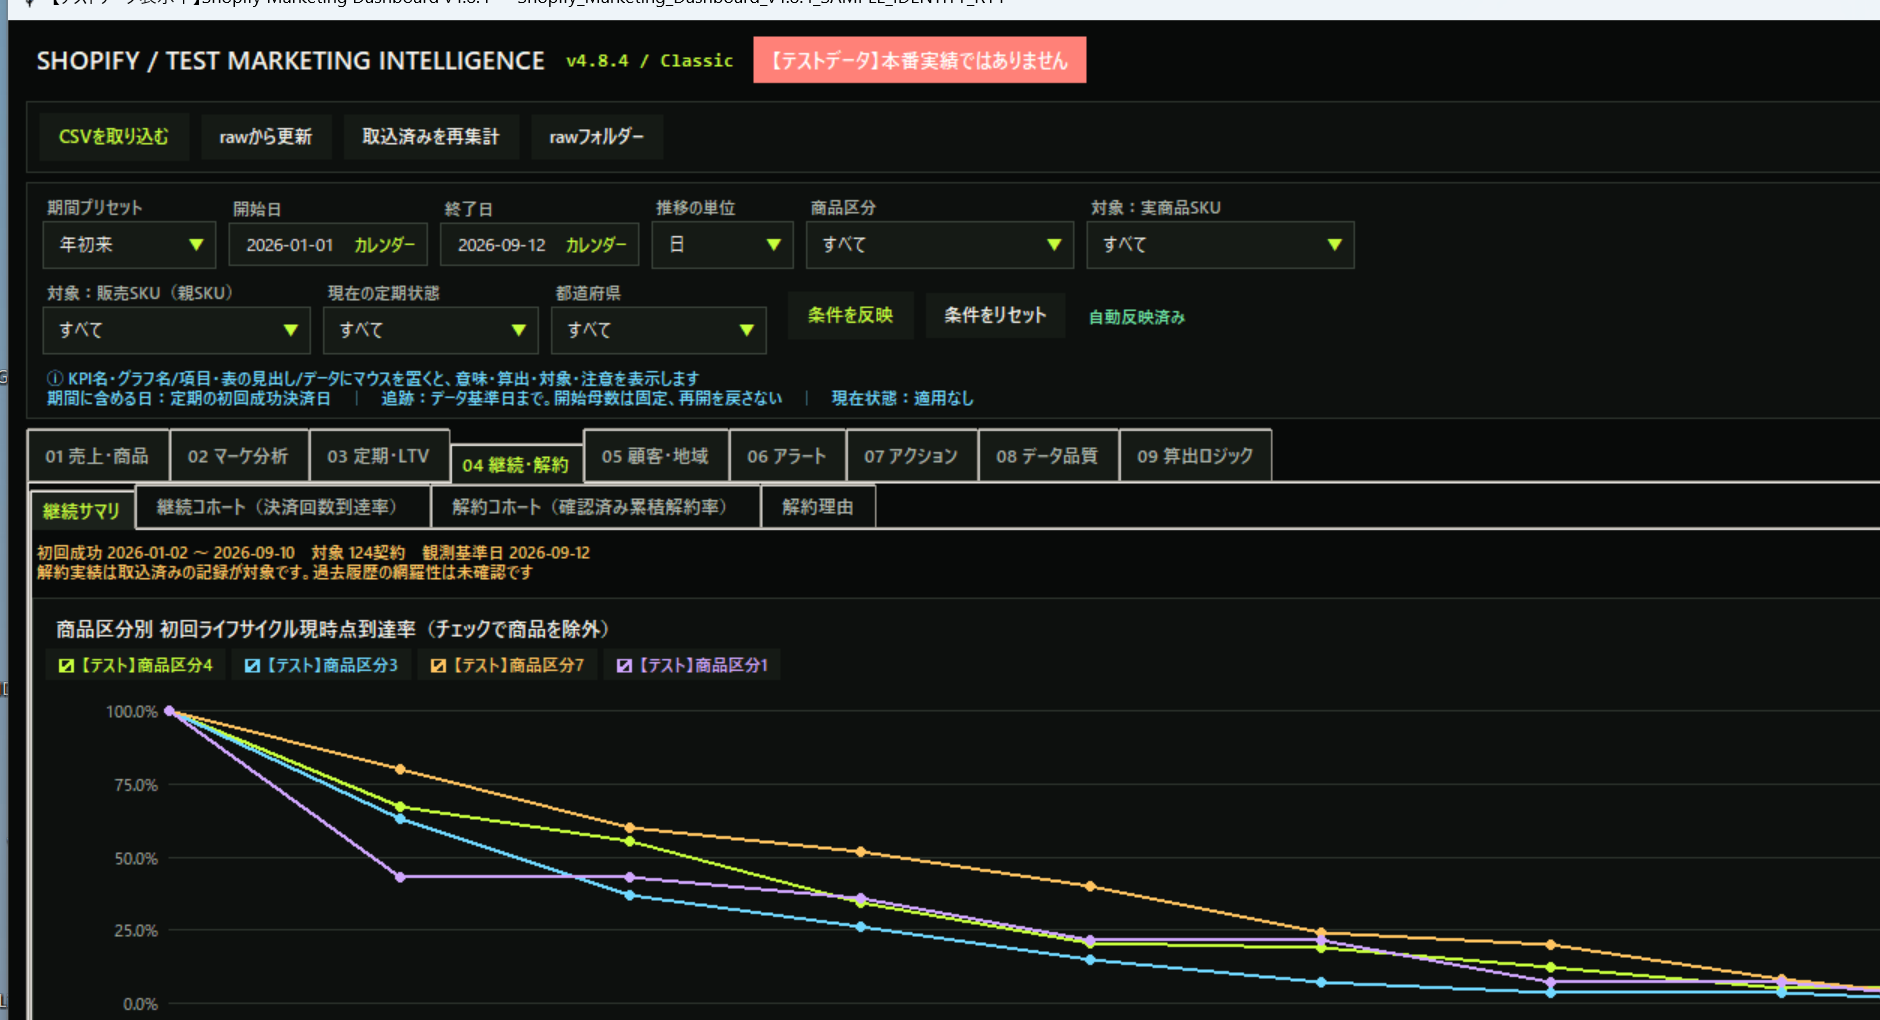
Review retention curves, cumulative churn, contract status, and cancellation reasons.
Customers and Regions
Review new and returning customers, purchases by customer, and sales and customer distribution by prefecture.
Data Quality and Metric Definitions
Review missing and unmatched records, exclusions, and refresh status. Metric definitions and formulas are documented in the dashboard.
Measure Subscription LTV and Retention from Contract History
Extending the LTV window can inflate results if canceled contracts are counted as future subscribers. This dashboard divides cumulative successful payments by eligible contracts and does not add sales that have not occurred.
The retention curve shows payment milestones reached after the first successful payment, rather than current contract statuses. Set a date range to compare any period. Milestones that have not had time to occur are labeled “Immature,” not 0%.
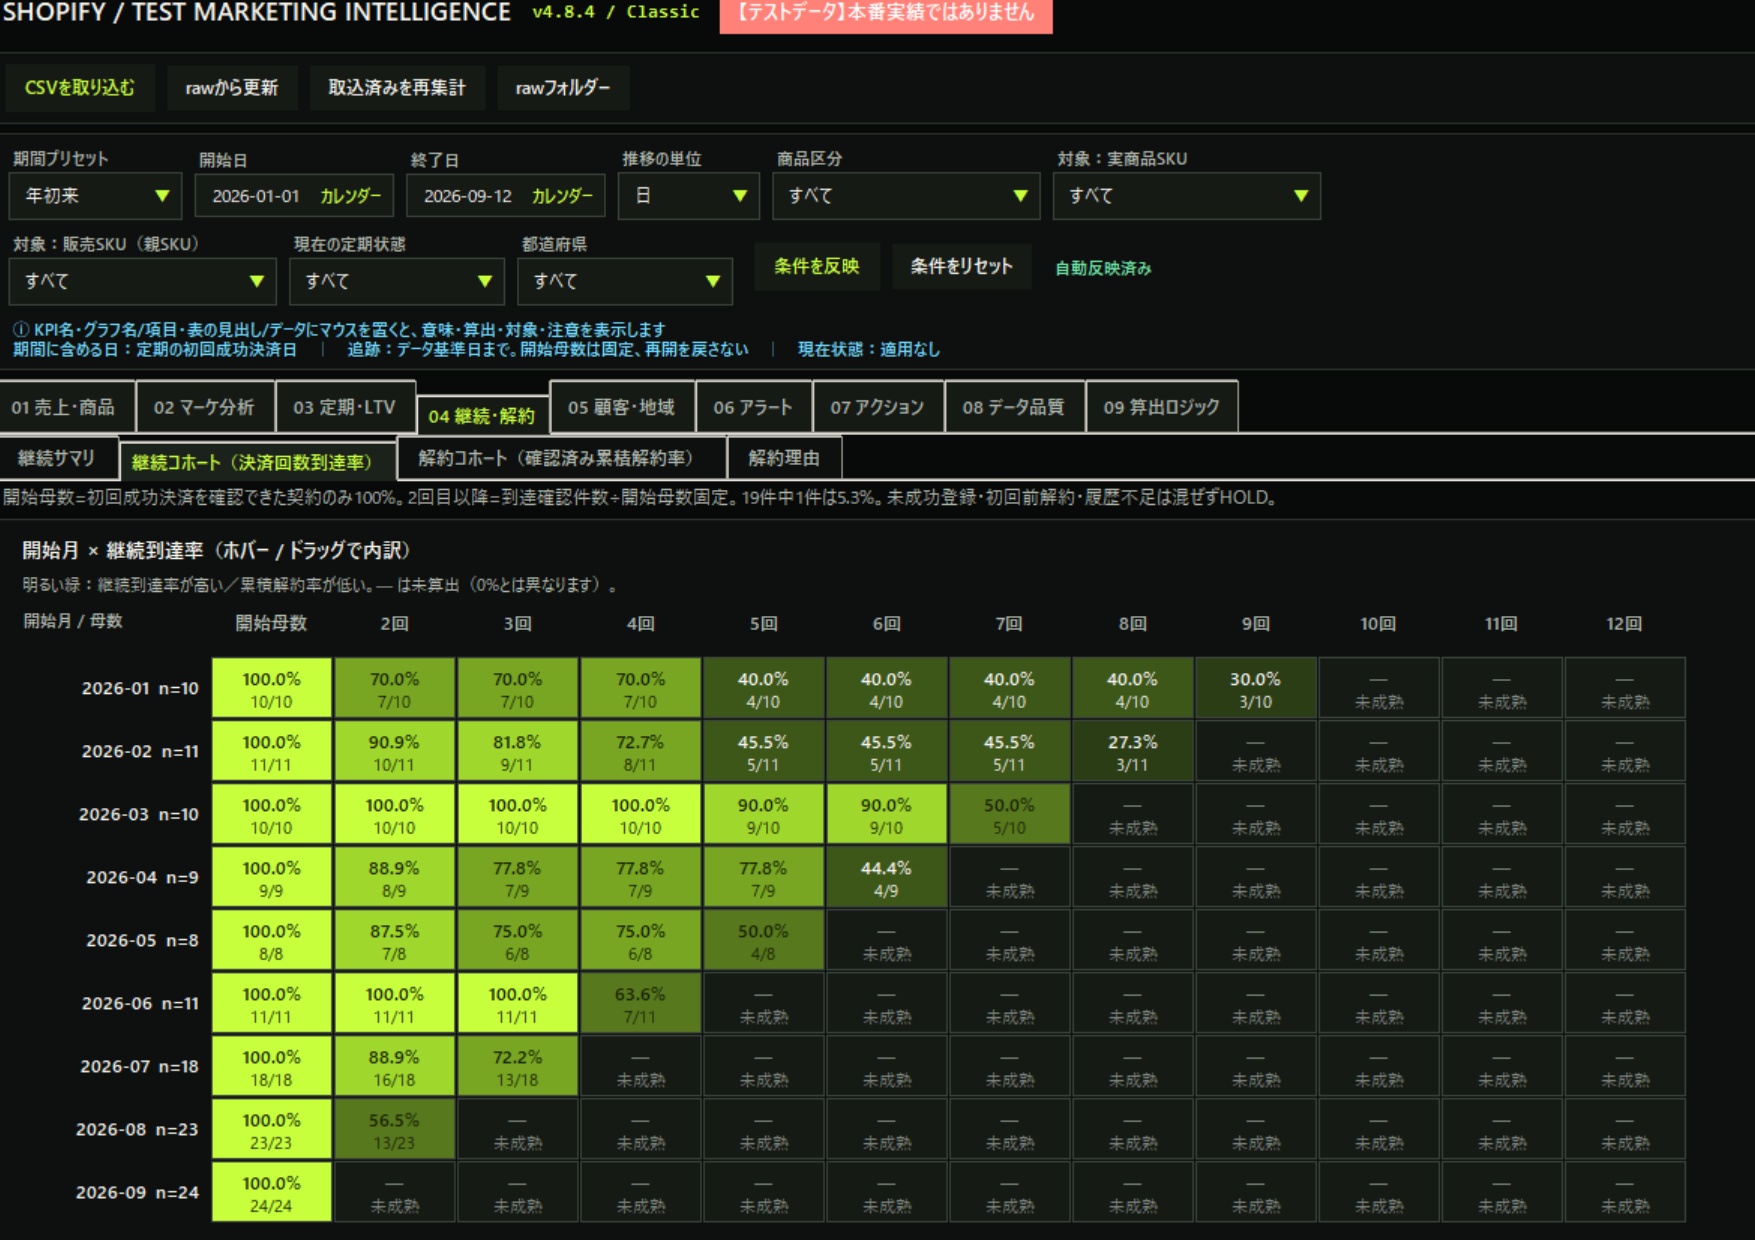
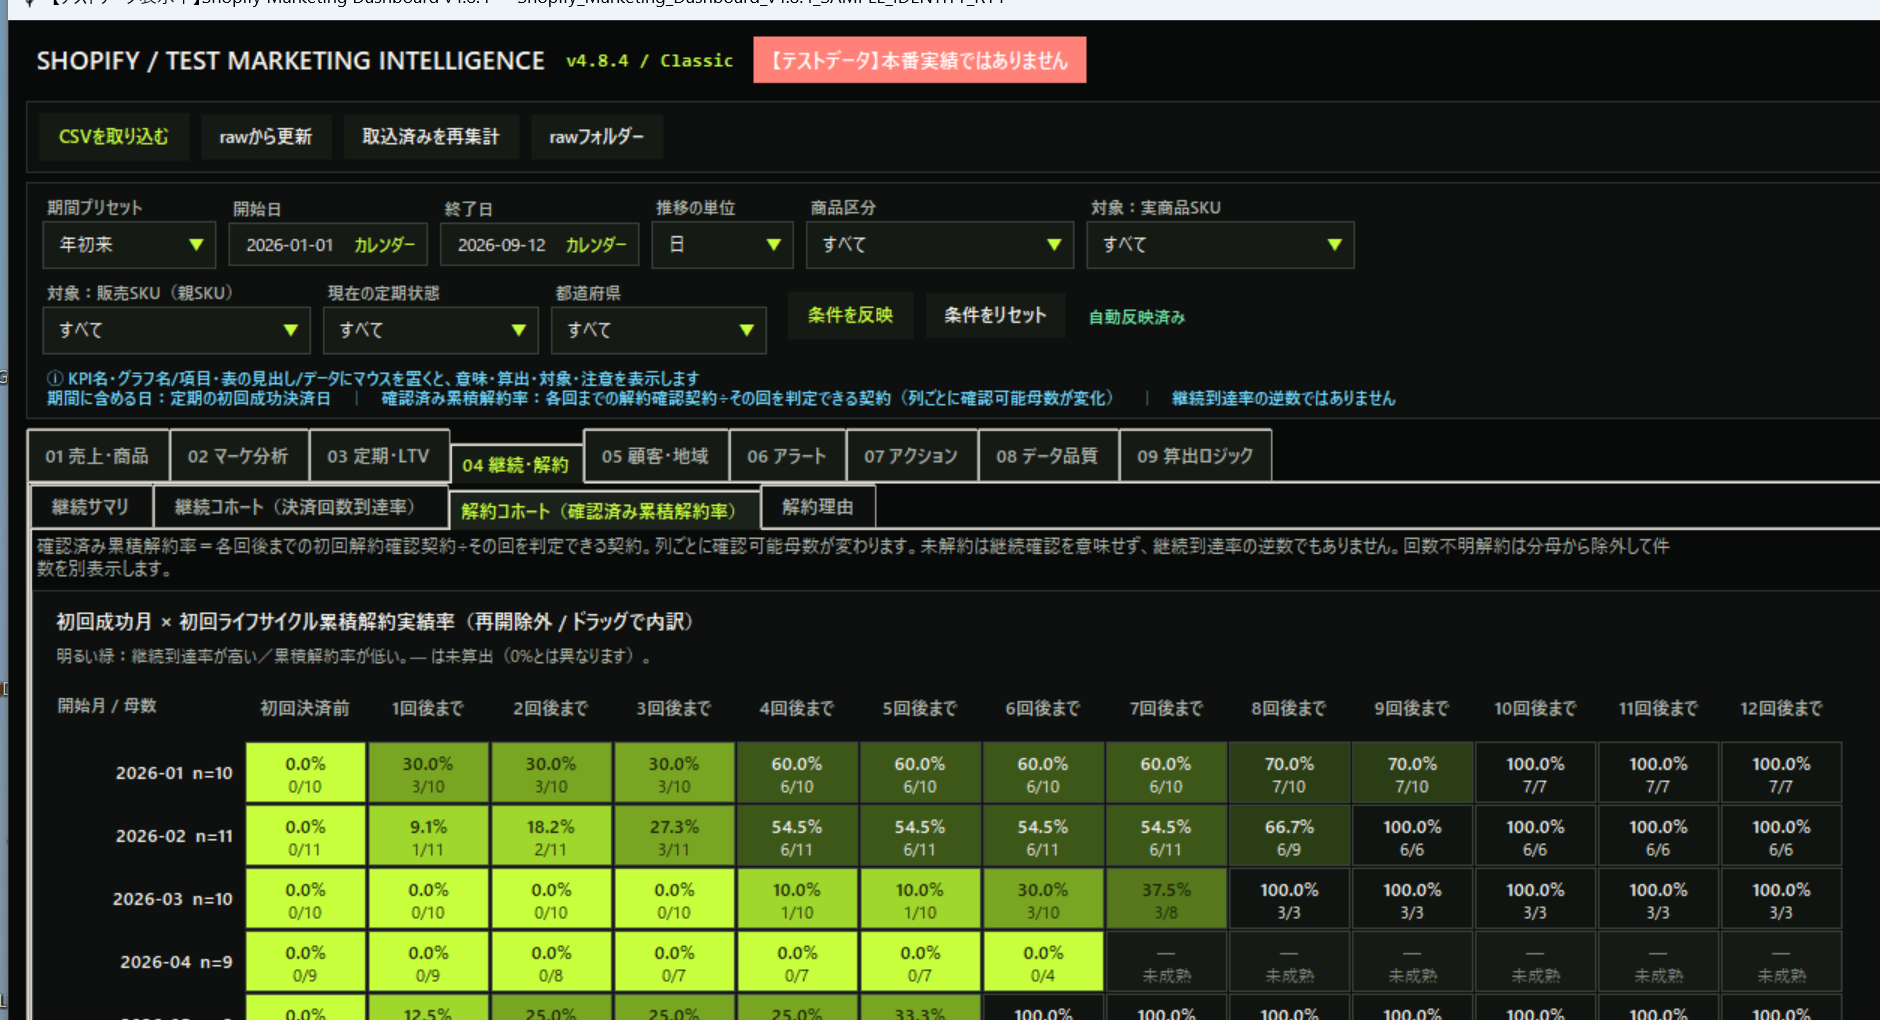
Validate with Test Data That Cannot Be Mistaken for Production
The public sample uses fictional data for about 2,000 orders. Product names and SKUs are marked “TEST,” with no real product master or names included. A test-data label appears in the dashboard’s upper-right to distinguish validation figures from production results.
The sample includes one-time purchases, subscriptions, cancellations, payment counts, coupons, refunds, unsettled payments, and costs, so each screen’s exclusions and totals can be checked. The data quality screen shows imports, exclusions, missing values, and unmatched records.
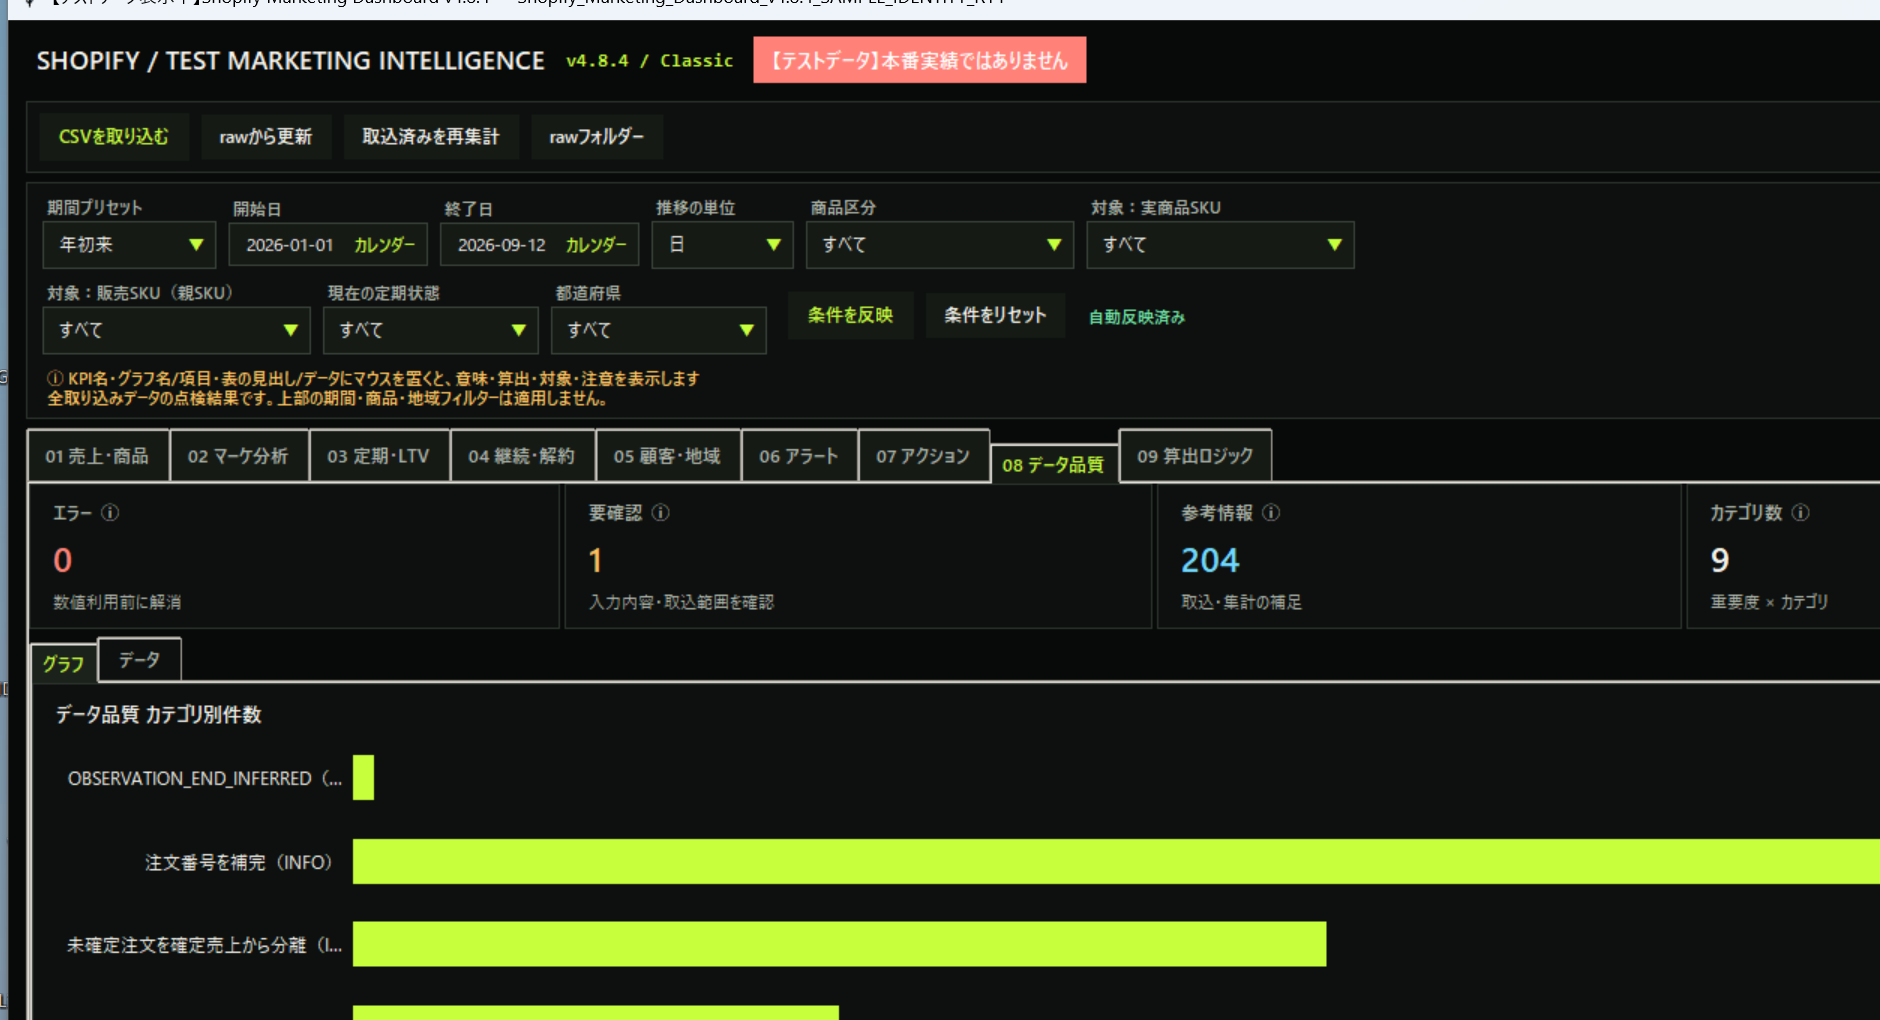
Run the Test Version
The test version is a local Windows tool. It does not send customer data to an external service: it reads CSV files on your PC and displays the dashboard in your browser.
Download the ZIP and extract the entire folder. Do not run the tool from inside the ZIP.
START_DASHBOARD.cmd to run. Python, Tkinter, and openpyxl are required.
Check the test-data label and data quality, then explore the tabs, filters, and metric help.
Before using production data, remove the four sample CSVs and sample product master, then replace them completely with your own four CSVs and product master before first launch.
Shopify Marketing Dashboard v4.8.4 — Test Version
A validation ZIP containing fictional orders, customers, subscription contracts, and a product master. No production data or product master is included.
Download the Test ZIPZIP / ~237 KB / WindowsDo not add test data alongside production data. Replace the full sample set under Raw with your company data instead of keeping samples and appending production CSVs. The TEST badge at the top right disappears when only production data remains; a warning appears if test and production data are mixed.
A Dashboard’s Value Comes from Verifiability, Not the Number of Charts
Bringing sales, customers, products, and subscriptions onto one screen will not speed up decisions if definitions are unclear. First decide which orders count as sales, how customers are identified, where one-time purchases and subscriptions are separated, and how refunds and pending payments are handled.
Each metric includes its meaning and calculation. If a number looks wrong, trace data quality, the reporting period, filters, and formula from the same screen. This dashboard is designed as a verifiable basis for decisions, not just a report.
Conclusion
Data Specifications Referenced
Import fields were finalized by comparing official service exports and published field definitions with the CSVs actually produced.
Shopify Help Center | Importing and Exporting Customer Information
Huckleberry Subscriptions | Exporting Order and Contract Data